

Qualitative Illustrations
Showing, Not Telling
You want to utilize visual representations and illustrations as compelling tools, transcending traditional data presentation and elevating the accessibility and impact of your qualitative research.
We skillfully visually depict the intricate nuances of emotions, behaviors, and trends inherent in your qualitative data, fostering a deeper understanding and connection with the insights gleaned.
Illustrating Mind Maps

For this project, we worked closely with the qualitative researcher and analyst to translate their findings into a powerful illustration that resonated with all parties.
The researcher’s client - a major computer manufacturer and software company - wanted to better understand what the typical computer usage looked like for creatives and designers, in order to better design computers and software capable of handling designers’ daily needs.
Working with the analyst, we were able to combine their initial visual idea and analysis with specific examples from respondent mind maps to develop two re-designs to be featured in the final report to their client.
Upon seeing the re-designs, our researcher client stated: “This is totally me. It’s like you transplanted my desk into this image...”
(We later found out that their client had a similar reaction. #goals)
Driving Home Key Points

For this project - in partnership with the qualitative research team - we were tasked with creating an illustration to help drive a key point .
The client - a major luxury hotel brand - wanted to better understand customer expectations around international luxury travel and hotel choices, in order to better serve this population segment. Working with the research team on this multi-national project, we discovered a large ‘gap’ between luxury travelers’ expectations and their actual experiences existed amongst all international and domestic markets.
Our research team asked us to help them design slides that would drive home this key point, while at the same time allowing the research team to identify market-specific insights, as well as include other findings and quotes.
Reflecting Population Emotions
Our research team’s client - a pharmaceutical company - had recently developed a supplement to help women suffering from Polycystic Ovarian Syndrome (PCOS) and wanted to better understand the process these women had to go through to get their diagnosis and treatment plans, in order to better plan their marketing strategy for this new product.
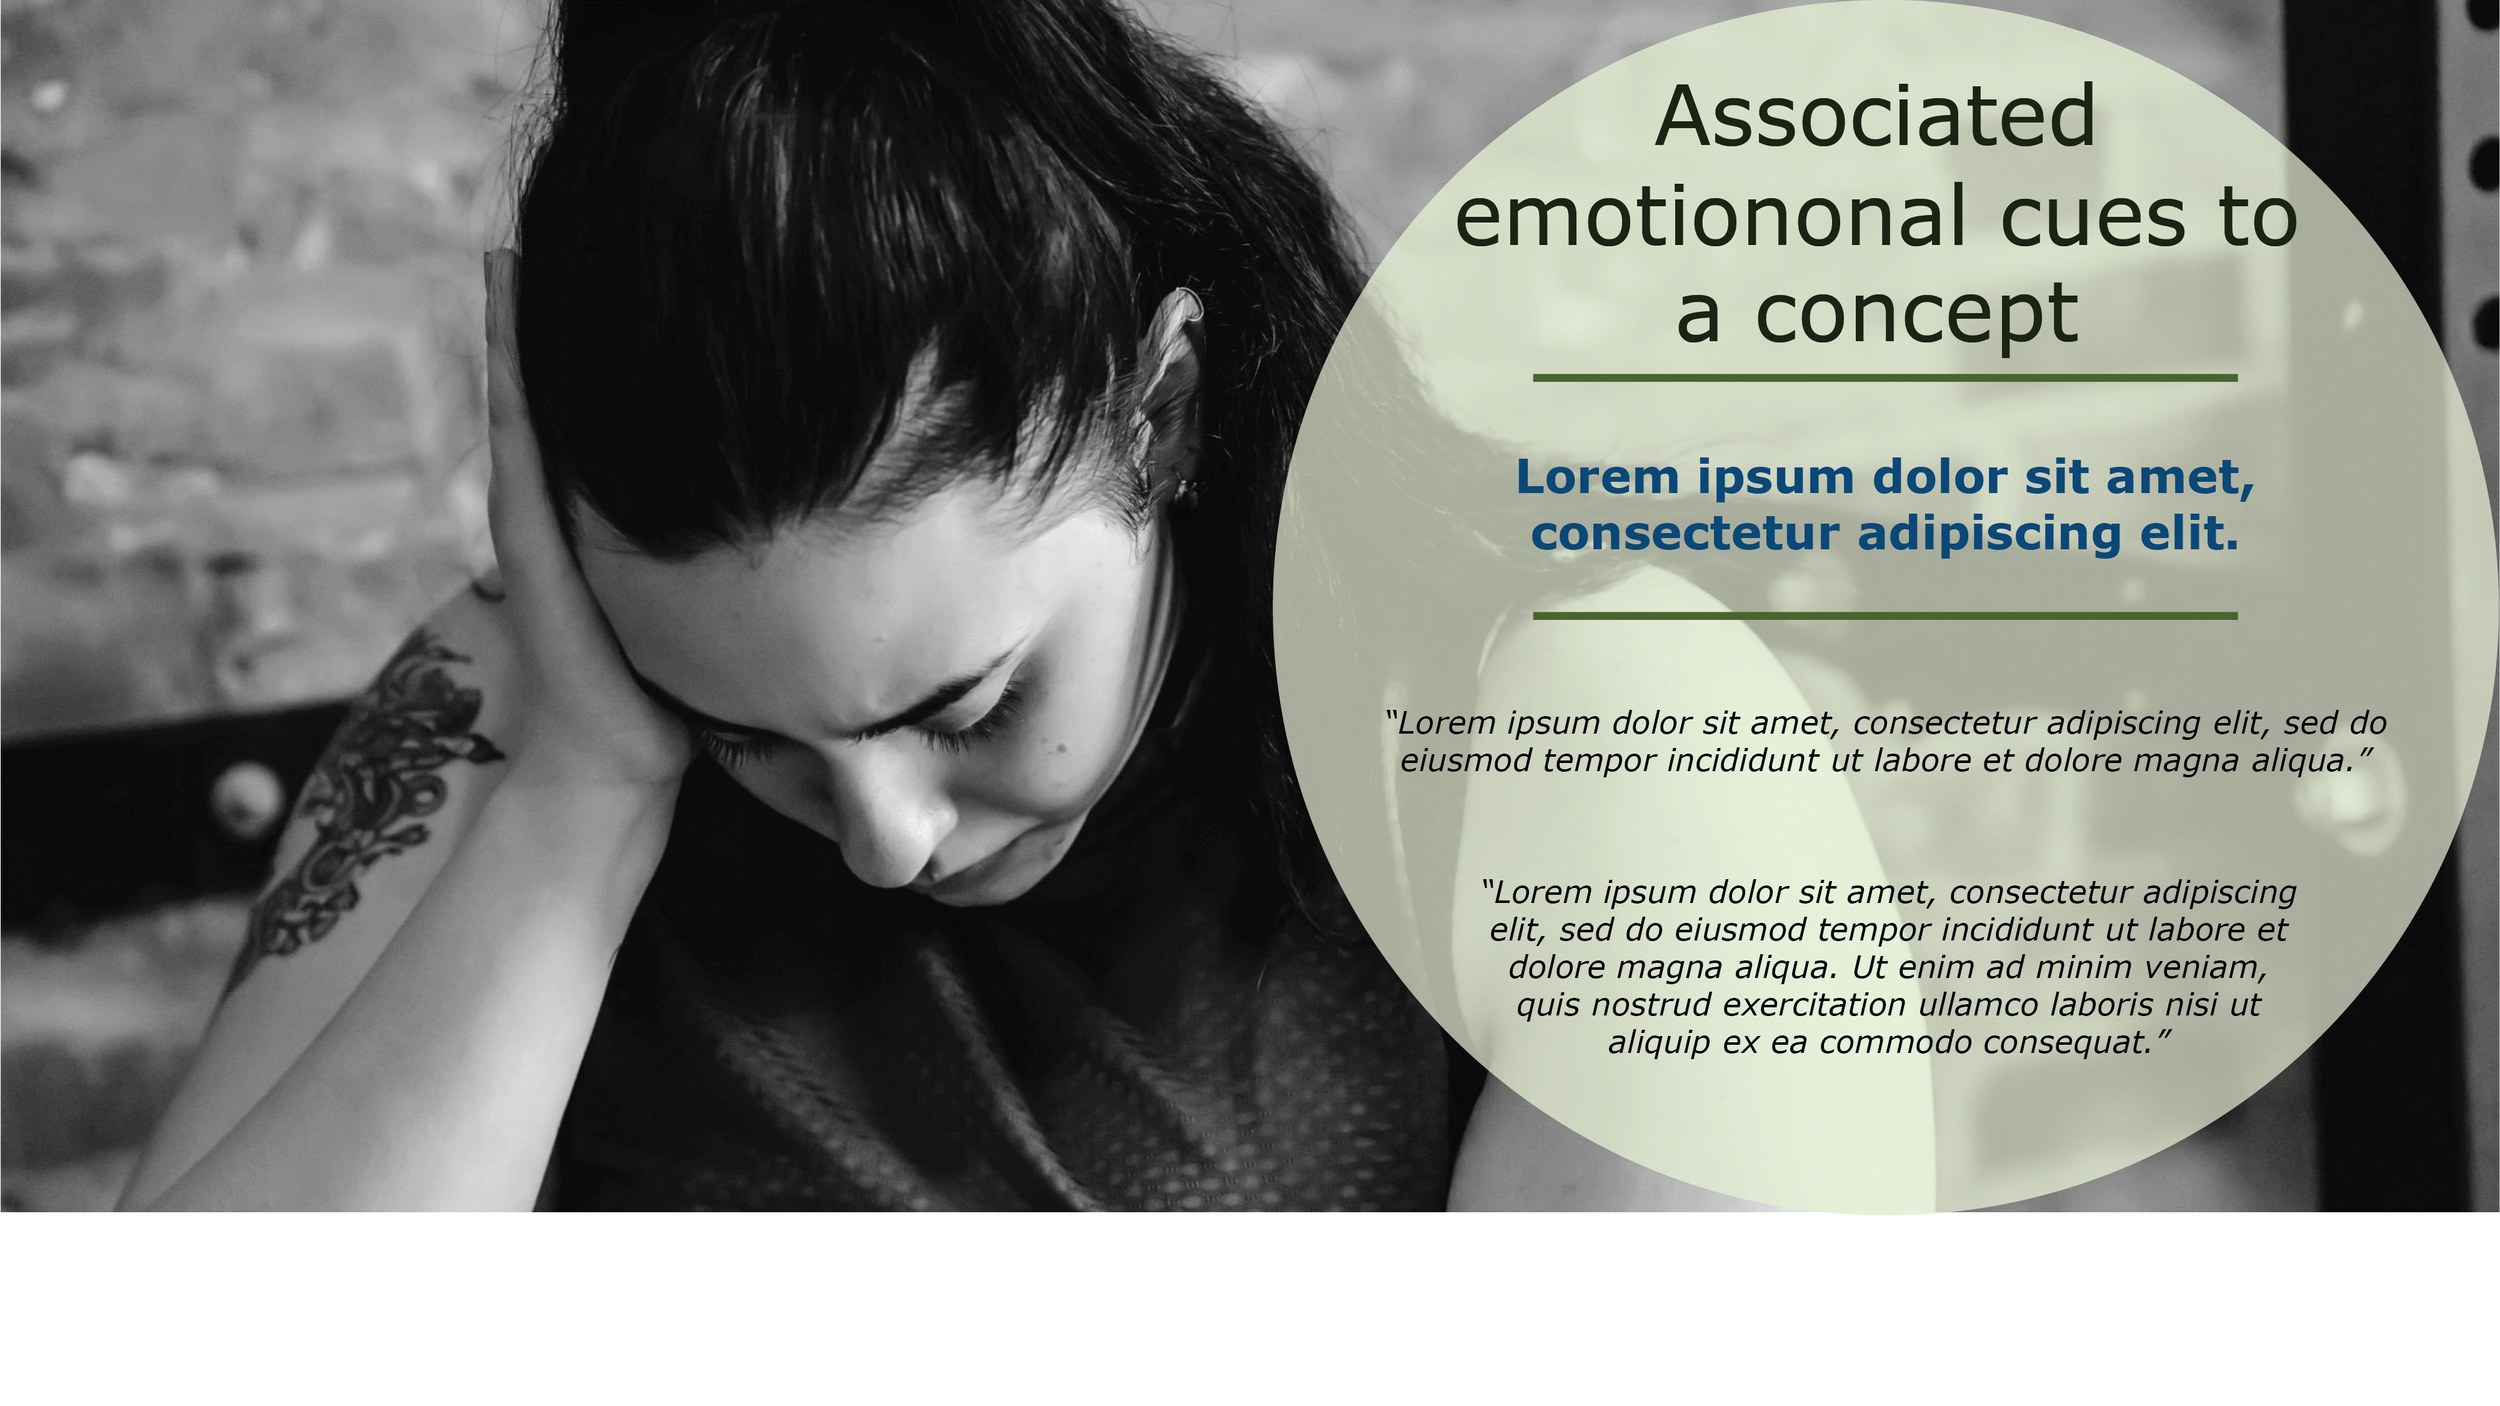
During the course of the study, working closely with the research team, we uncovered the emotional drivers that contributed to and affected PCOS suffers’ diagnosis journey. We then used imagery to illustrate and convey the mental, emotional, and social stigmas that set the tone for how these women see themselves.
This helped the client (especially the men on the team) to sympathize with the emotions these women regularly deal with, while also informing the client’s planning their marketing strategy around this new product.
Aiding Journey Map Development

For this project, in partnership with the qualitative research team, we were tasked with creating an illustration to help aid the visualization and creation of a Journey Map.
Our client - a major sports apparel and footwear company - desired to better understand the journey users of their app undertook to become avid runners, in order to update and redesign their app to better serve this community. As the analysis was being discussed, we realized that research team members (as well as the client) kept describing the journey as a ‘snowball effect’. So, we developed a ‘snowball effect’ visual to help anchor and assist the creation of app users’ Journey Map.